
By Tim Oren
So that one’s in the books. Although my last few columns were focused on PACs, our host Brian Almon had a nice wrap-up on X, so I’ll skip repeating that. I’ll just observe that it cost the PACs and donors almost $110 per vote to keep Team Illegal’s goalie Jim Guthrie on the ice. It’s obviously worth a lot of money to dead end certain bills.
Instead, I’ll look at some possible future implications. For that, I’m bringing back my map of the 2026 House session with some additions:
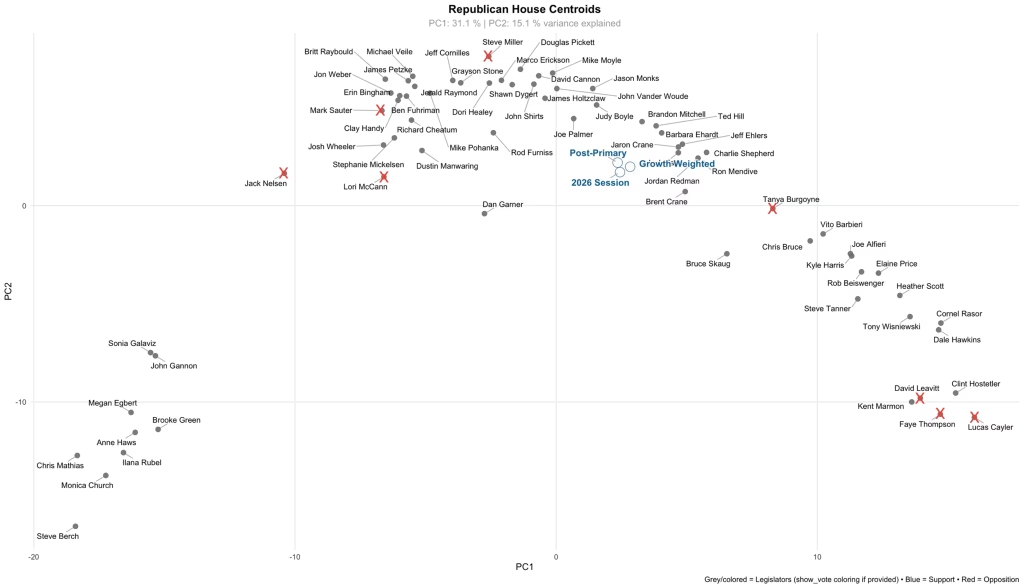
There are three added circles:
‘2026 Session’ is the centroid (center of gravity) of the Republican caucus as measured by the divided votes during the session.
‘Post Primary’ is the centroid after removing those House members who retired or were defeated. It moved a modest amount in the IACI/RINO direction. The actual outcome depends on how the newly-elected legislators vote in the future, of course, but I suspect they will note that the departed (red X’s) were concentrated at the extremes of the caucus. I anticipate a wave of centrism.
‘Growth-Weighted’ takes a little explaining, and is the main topic of this post:
Brian observed the differences in outcomes and political establishments across Idaho’s two congressional districts. I decided to pursue that theme further, looking at Idaho legislative districts.
The Idaho Secretary of State’s office publishes voter turnouts at the precinct level. Turnout itself is not so interesting as a forecasting tool, as it is dependent on having close and contentious local races. But the SOS data necessarily includes the registered voter total, which can be aggregated up to the district level. The current Idaho districts were formed after the 2020 census, with equal populations within a few percent. You might guess that the number of voters in each district would thus be roughly equal, but they aren’t, and it points to some interesting futures. Here’s a district map, colored based on variation from the average number of registered voters per district. Higher is darker, lower is lighter:
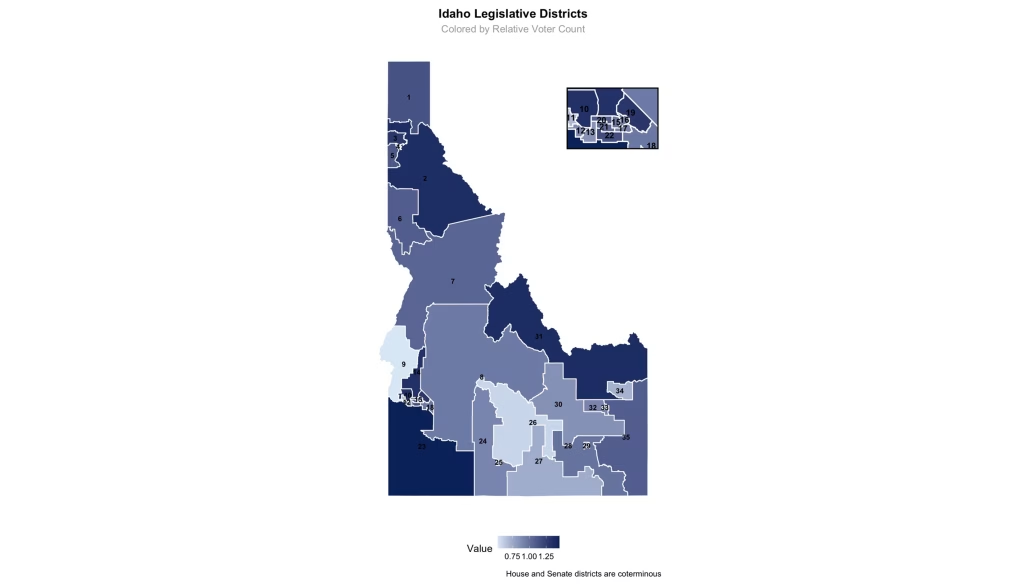
There are two things going on. The first is growth. The 2020 census is now six years old, six years of heavy migration into Idaho. Living in Treasure Valley, I can certainly verify that districts 10 (Star, Middleton), 14 (Eagle, Emmett), and 23 (Nampa) have been growing like weeds. I assume that’s the case with the others that are significantly above average: More houses, more families, more voters. (District 19 is where unrepentant Blues land – Idaho’s version of the Big Sort – but it doesn’t figure in Red primaries.)
Then there are districts conspicuously and puzzlingly below the average number of registered voters: 9, 11, 26, and 34 most dramatically. The answer comes from the census: The number of registered voters is negatively correlated with percent Hispanic population, at a p-value < .0001. That percentage is a close proxy for the fraction of adults who can’t vote, because they aren’t citizens.
Hence, the light blue districts represent Idaho’s dirty little electoral secret: We have our own version of those blue states that get more Congressional seats than they should by counting illegals. Idaho has districts where each actual voter gets extra weight in Boise because of the migrants used to calculate the district sizes, weight that is being used to keep the illegals here. Meanwhile, citizens in the dark blue districts have their votes diluted.
Taking me back to the third circle on the 2026 House map. That’s what happens if I reweight each district’s surviving representatives based on the actual registered voters, such as might happen in a future reapportionment, one that included the newly arrived citizens, but excluded counting non-citizens.
That possible change in center of gravity might not look like much, but it would more than reverse the primary outcomes. Yet another reason why Team Illegal needs its goalie.
Afterword
This will be my last regular column here for a while. I suspect the approach of the November general election will generate more interesting data, so stay tuned.
For the stats minded:
Call:
lm(formula = district26$PctAvgVoters ~ district26$Hispanic)
Residuals:
     Min       1Q   Median       3Q      Max
-0.36924 -0.11166 -0.01499  0.10122  0.49010
Coefficients:
                    Estimate Std. Error t value Pr(>|t|)
(Intercept)          1.22266    0.05782  21.145  < 2e-16 ***
district26$Hispanic -1.71308    0.37635  -4.552 6.87e-05 ***
---
Signif. codes:  0 ‘***’ 0.001 ‘**’ 0.01 ‘*’ 0.05 ‘.’ 0.1 ‘ ’ 1

Residual standard error: 0.1824 on 33 degrees of freedom
Multiple R-squared:  0.3857,	Adjusted R-squared:  0.3671
F-statistic: 20.72 on 1 and 33 DF,  p-value: 6.865e-05
The Gem State Chronicle delivers daily analysis, op-eds, press releases, and Idaho Insider updates — free to your inbox.
Free newsletter · Unsubscribe anytime · View on Substack

About Tim Oren
Tim Oren retired to Idaho after a 30 year career in Silicon Valley. Here he gardens, home-brews, teaches kids to shoot, and has applied his well-aged statistics degree to subjects such as educational funding and results, Idaho legislative race targeting, and now legislators' voting patterns. He is a contributor to the Idaho Freedom Foundation and a number of Idaho candidates.